I've always enjoyed reading, not necessarily understanding it, your posts.
You ain't the Lone Ranger! Judging by the number of PM's, emails, and the chatter within the threads when I participate....there are times I feel like no one understands what the Hell I'm trying to say! LOL
In all fairness it's complex subject matter that most are totally unfamiliar with and I struggle with it much more often than many of you probably think I do.
Please add, change, derail or whatever any thread of mine you wish! I'm always fascinated!
Wow! Free reign to make your life miserable every time you post! LOL
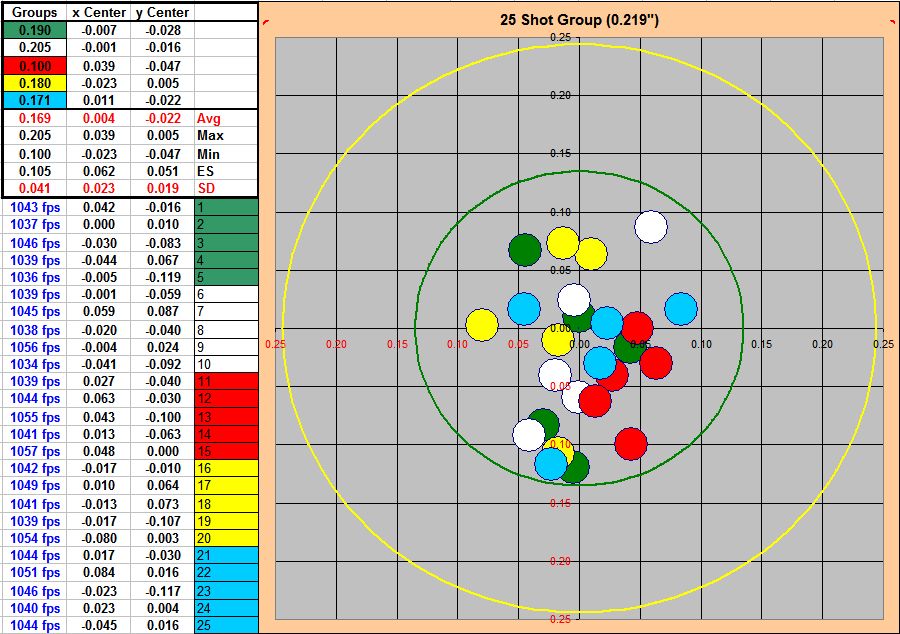
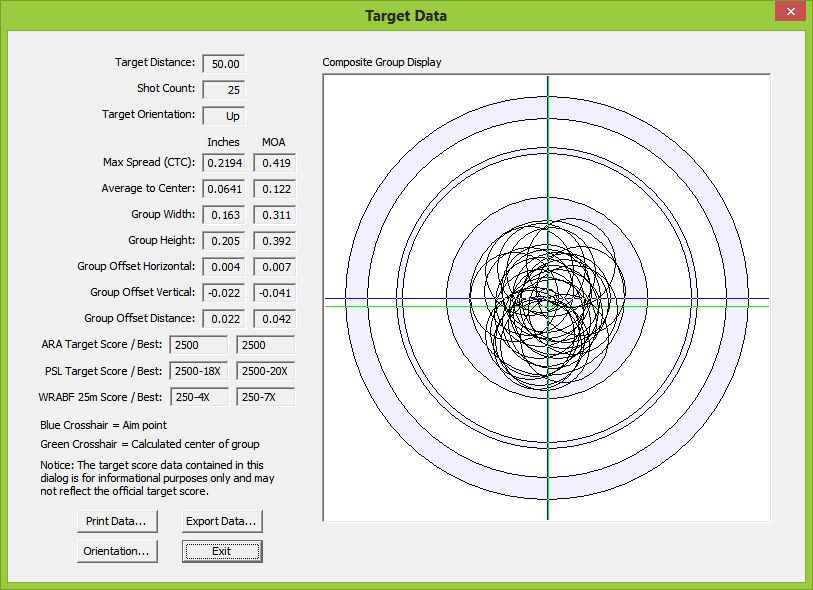
I can see using the software where group shooting is measured & has actual math put to it. There is no doubt once used you'll know the best shooting ammo you've tested.
I wish it was true that I always pick the best ammo when I lot test, but unfortunately that's not true unless there's a rather large difference between my choice and the other ammo I've tested. Even with the methods I employ, it boils down to making decisions based on statistical confidence levels.
I'm 100% confident I'll be correct more often than you, but that's in no way the same as saying I'll be correct 100% of the time.
In the majority of cases, we have to get a little lucky in order to find those lots that might be considered "Killer", because I think everyone is in agreement that it's not possible to lot test bricks vs 1 or 2 bx's. It's easy to find good ammo and reject bad ammo, but incredibly difficult to determine if it's "Killer" and not just "good" before you purchase it.
The #'s don't lie & you can put that into real world target scores.
Real world target scores? That reminds me of some work I've done in the last month or two and I think you and others may find it interesting. It should also assist everyone in setting benchmarks based on groups shot during your testing if your preference is to continue shooting groups rather than buying software and working with statistics you're not familiar with.
I've always been interested in how the statistics I generate during testing translates to real world target scores. What I did was write algorithms based on the data I've gathered that most closely match the scores I've shot in my tunnel, the scores I've shot in indoor matches with little or no mirage, and the outdoor matches I've shot under near perfect conditions.
I could have written the algorithms without using any of my data because the means to do so are pretty well known. The only thing you really need is a specific circle diameter that the shot distribution lands in, or in this particular case the scoring ring diameters of the ARA target to predict potential scores based on which statistic you choose to use for that estimation.
I've also written the algorithms to do the same for the IR50 target, but I don't have the time to do so. Just thought I'd mention that because I believe you shoot mostly IR50 and might ask if I'm able to do that.
A brief, and I hope, simplified explanation of the following charts is probably in order. It may not be simple enough for everyone, but I've already said and will say some things that may horrify a real statistician. I'm sure they'll forgive me considering I'm just some hick in Nebraska pretending to be an expurt. LOL
All 3 charts use the same data from a single barrel utilizing the same 3,375 shots. I didn't look, but there's probably some 30 to 40 different lots of ammo in the data.
The reason I mention the number of lots is because I believe that may be the best way to make a determination of whether or not you should give up on a barrel and/or build and start anew. If after I've tested some 20+ lots and the charts I'm presenting suggest none of the results are competitive, I'll rebarrel or start a new build. If I sell the rifle I've given up on, I'll either rebarrel it before I sell it or tell the new owner they might be better off rebarreling it because the odds are they won't be happy with it. I don't want to lay awake at night thinking I'm guilty of selling junk even if I take a hit financially.
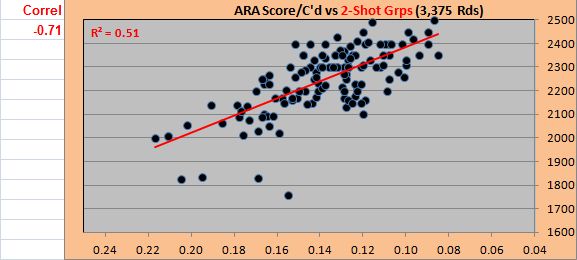
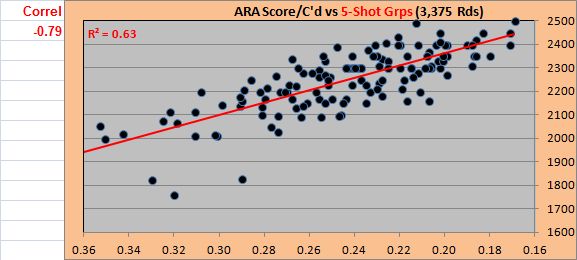
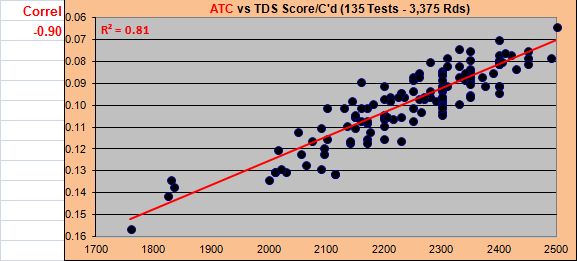
All 3 charts show the relationship or statistical correlation to real world scores (ARA Score/C'd) for testing results using 2-shot groups, 5-shot groups, and ATC (Average To Center) also known as MR (Mean Radius).
The red line thru the data points is a trend line and in this case it's a linear trend line. Excel calculates the best fit thru the data points and creates the line.
R2 is a calculation Excel uses to tell us how well the data fits the trend line. Higher numbers are better.
Correl is the term used in the Excel formula bar and is short for correlation. Whether minus or positive, the higher the number the closer the relationship or the higher the correlation is to predicted scores.
You should notice there is some scatter that prevents you from drawing an intersecting line from the group size average in the horizontal axis of the charts and predict an exact score. This scatter is perfectly normal and can only be lessened with the addition of more data. Considering this data is composed of 135 separate tests and 3,375 total rds, it should be obvious why scores vary so much from target to target even under benign conditions with the same rifle and ammo.
The other important result to notice is how the prediction for real world scores suffers if for some reason you were to decide to use 2-shot groups in your testing. The same happens if you use anything other than groups with 5 to 6 shots in them. Testing using 2-shot, 3-shot, 10-shot groups, etc don't work well when testing ammo or evaluating rifle performance. Again, this is well known but probably unfamiliar to most of you.
There's a lot to digest here and I'm certain there will be disagreement. All I can do is present the data and let everyone draw their own conclusions.
I'd also like some input as to how understandable this is. I don't care if anyone disagrees with what I've said....just want to know how many of you can make sense of it. I'd really appreciate the input.
Thanks,
Landy
2-Shot Correlation:
5-Shot Correlation:
Average To Center Correlation:


